Best Remote Work Tools for Data Analysis and BI Teams
Data teams went from messy spreadsheets to a full analytics stack. These remote-friendly tools help analysts connect databases, run analysis, build dashboards, and share insights across distributed teams.
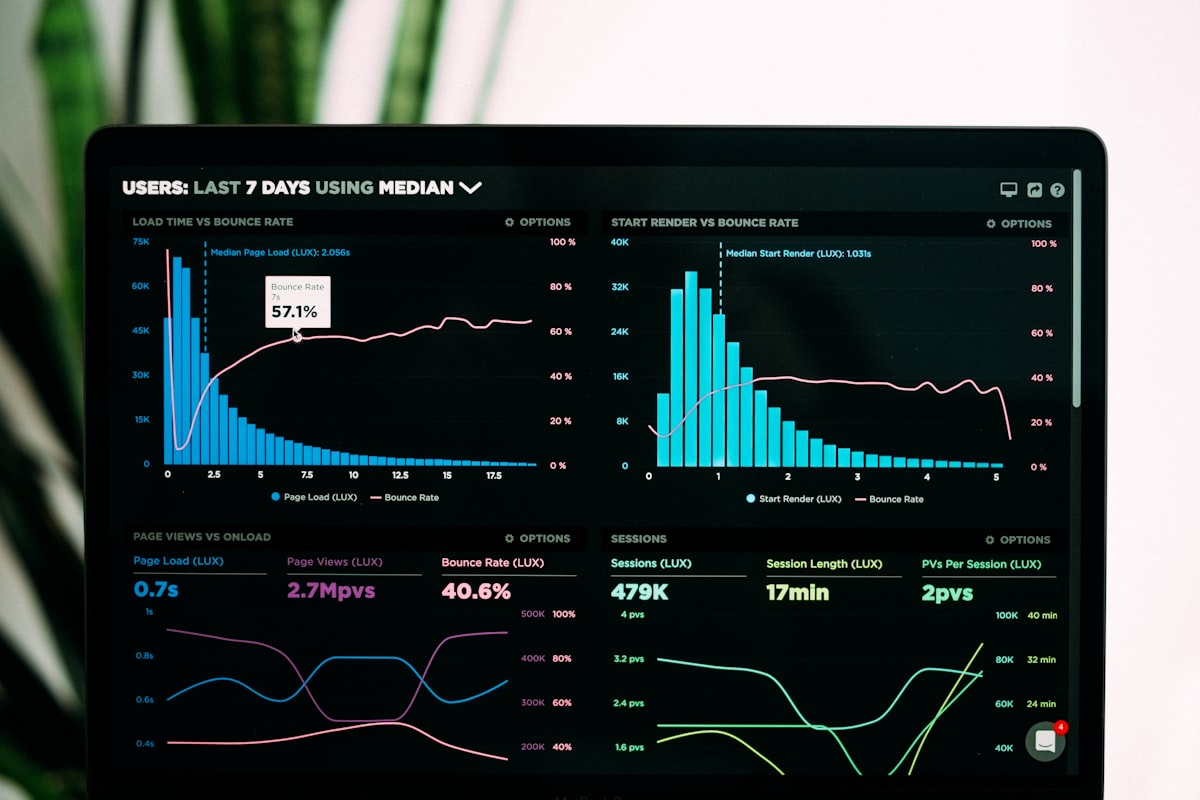
Best Remote Work Tools for Data Analysis in 2026
A few years ago, during a Monday-morning dashboard check, I opened nine tabs, seven of which were still loading. By noon I still couldn't answer a single question with a single number. That's the analyst's struggle, and it's a symptom of a mess you can fix a little at a time with a proper remote analytics stack.
Data analysis has always been semi-remote, but the era of everyone at home made a complete stack essential: a data warehouse, a SQL workbench, a dashboard, a notebook, and a shared semantic layer. Here's what the best remote data teams rely on in 2026.
Storage and Warehousing: The Remote "Office"
Snowflake and BigQuery: The Modern Data Cloud
Snowflake and Google BigQuery are the default modern data warehouses. They store petabytes, run SQL at massive scale, and let you query shared data without ever copying large tables onto your laptop.
Remote teams benefit immediately: no more "the VPN killed it," no more "the database is locked." Your entire analytics environment lives in the cloud, so everyone queries the same source of truth from anywhere in the world.
Fivetran and Airbyte: Automated Data Movement
These are the connectors of the modern stack. Tools like Fivetran (managed) and Airbyte (open source) sync data from your SaaS apps, databases, and event streams into the warehouse, automatically and continuously.
In a remote team, automation is everything: pipelines run themselves overnight, and the analysts wake up to fresh data instead of waiting on someone to run a script. That's the real workflow win.
The Session: Notebooks and SQL
SQL Editors and Databases
For actually writing queries, remote analysts lean on interactive notebooks like Hex and Deepnote, or classic SQL editors such as DBeaver. They connect to the shared warehouse, save queries as reusable assets, and turn analysis into something the whole team can see.
dbt: Transform Data as Code
dbt has become the modern analytics workflow for transformation-as-code: SQL models, version-controlled, with tests and documentation built in. Because dbt lives in git, remote teams get code review and CI on their data pipelines—the same discipline engineers use, now applied to analytics.
Dashboards and Reporting: Insights, Not Just Charts
Looker and Tableau: The Sharing Layer
Looker, Tableau, and similar tools are the presentation layer: they turn a warehouse into interactive dashboards, pinned lines, alerts, and embedded views. For remote teams, the key is that dashboards live in the cloud and update automatically—nobody is emailing screenshots of a stale spreadsheet.
Metabase and Grafana: Self-Serve for Everyone
Open source options like Metabase and Grafana give non-technical teammates self-serve access to the metrics they care about. Clear, opinionated UIs lower the barrier, so stakeholders answer their own questions without blocking the analysts.
Spreadsheets Still Count
Google Sheets and Excel
Don't underestimate the humble spreadsheet. For quick quarterbacking, ad-hoc analyses, and the dashboard that's actually "just a table a stakeholder loves," Google Sheets and Excel remain the most trusted tools in the stack. The key is discipline: sheets are for quick answers, warehouses are for the source of truth.
Keeping Humans in the Loop
Slack, Hypothesis, and Notion
Data never travels alone. London brainstorming happens in chat, structured notes live in Notion, and decisions get recorded in a decision log. The extra minutes of context you add when you share a number—the assumptions, the caveats, the date range—are what make remote data work trustworthy.
Loom for Async Reviews
Dashboards + a short Loom walkthrough beat a 40-minute meeting. Record the chart, explain the change, and drop the link in the channel. It keeps everyone in sync without forcing every timezone into the same call.
The Best Remote Analytics Stack Is the One You Actually Use
The route to remote data maturity is consistency over heroism. Start by defining the three numbers that matter most, connect them to the warehouse, build the dashboard in a day, and post it to the same channel every week.
The teams that win are not the ones with the most tools, but the ones who turned one tool's numbers into a habit. Whether it's BigQuery and Looker or Postgres and Metabase, keep it boring, keep it shared, and keep it green. A small number of well-loved tools beat a huge menu of half-loved ones.
Final Takeaway
Remote data analysis isn't about a fancy UI—it's about turning scattered data into a single honest source of truth that the whole team can look at from anywhere. Build that, and your data team will feel like they share one office even when they're on three continents.
About this guide
We publish practical, experience-led tutorials and tool guides for remote teams.
- Published: February 8, 2026
- Author: Taylor Reed
- Category: Productivity
- Estimated reading time: 10 min read
Our editorial standards and monetization disclosures:
Spotted an issue or have a suggestion? Email [email protected].
How we put this guide together
- We review official documentation and product pages for key claims.
- We focus on practical workflows (setup steps, everyday usage, trade-offs).
- We aim to keep guides current as tools change.
References
Official documentation and reputable resources related to this guide.
- Snowflake Documentationhttps://docs.snowflake.com/
- BigQuery Documentationhttps://cloud.google.com/bigquery/docs
- dbt Docshttps://docs.getdbt.com/
- Google Workspacehttps://workspace.google.com/
- Slackhttps://slack.com/
- Zoom Meetingshttps://zoom.us/meetings
Related Remote Work Tools Guides
View our complete Sitemap for all remote work tools guides.